Page's Lodging Decline Stabilizes After Spring Drop
June lodging tax collections fell 22.6% from a year earlier. Over the same month, hotel occupancy fell 6.1 percentage points. Those two figures describe the same downturn, and the distance between them is the most useful thing in this month’s data.
The June numbers
Total city sales tax generated in June was about $1.68 million, down 11.2% from roughly $1.89 million a year earlier. Fiscal year to date, collections are down 3.0%.
Lodging drove most of it. The hotel, motel, vacation rental, and bed and breakfast category collected about $610,000, down from roughly $787,000, a decline of 22.6% and about $178,000 in absolute terms. At 36.3% of all June collections, lodging was the largest single category that month.
The lodging tax rate did not change between these periods. The last adjustment took effect September 1, 2024, so both years are measured at the same rate.
The decline has been steady, not deepening
The shape of the decline matters more than any single month, and it is steadier than it first appears.
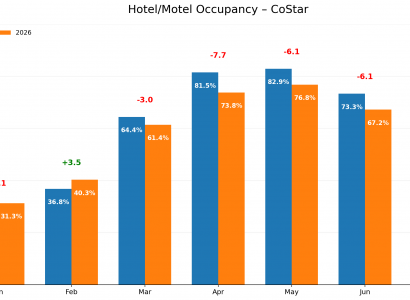
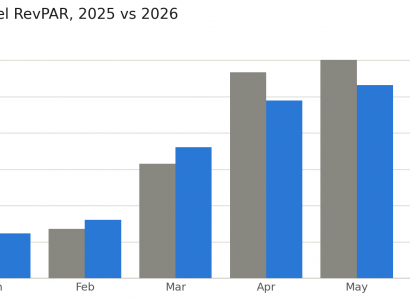
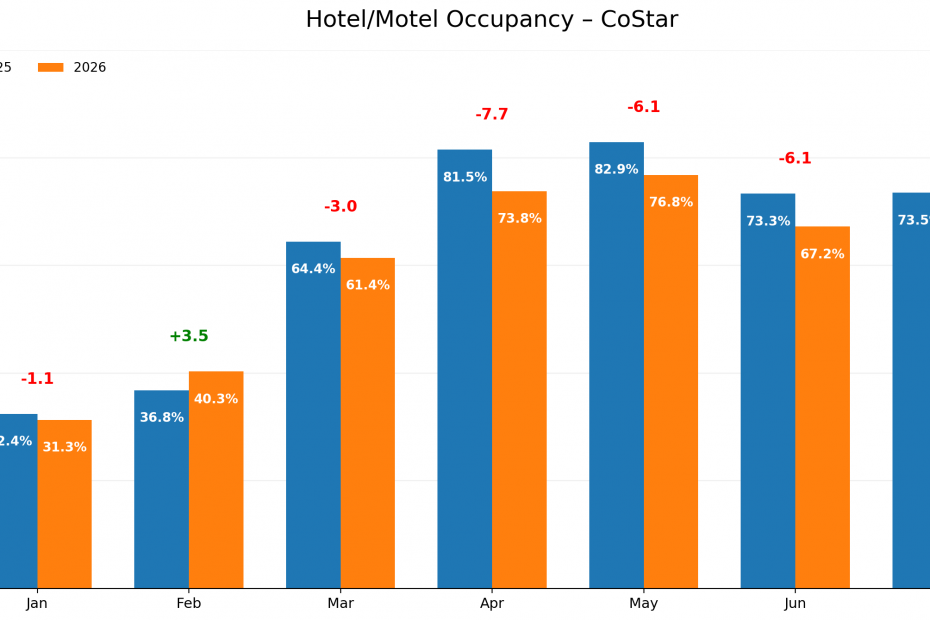
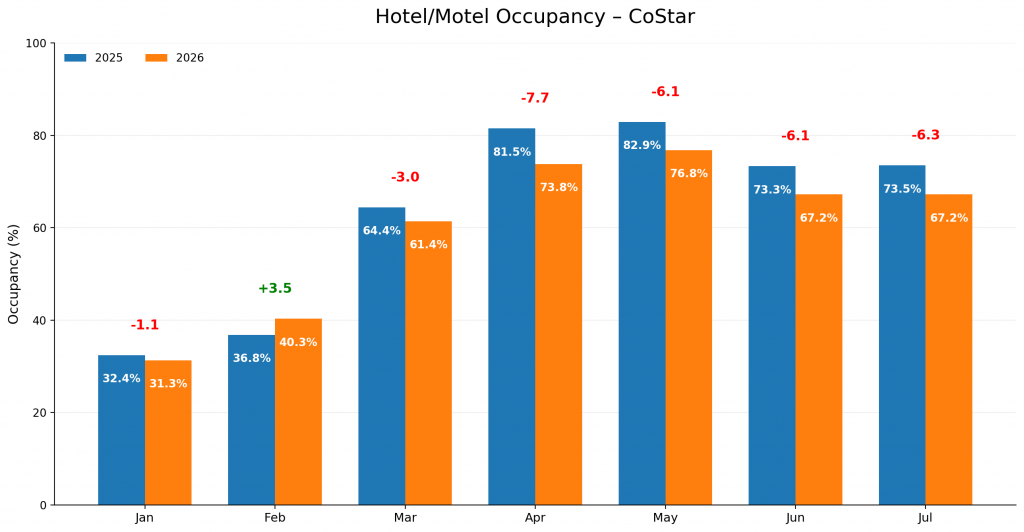
Since April, hotel performance has held at nearly the same level relative to last year. RevPAR declined 13.7% in April, 11.6% in May, 14.8% in June, and 14.8% in July. Occupancy ran 7.6 points below last year in April, then 6.1, 6.1, and 6.3 points in the months since. Average rate has stayed in a narrow band around 6 to 7% below 2025 throughout.
That describes a step down in April followed by four months of stability at the new level, not a market still falling. For planning purposes the distinction matters: a stable gap suggests the market found a lower level in spring and has held there, which makes the coming months more predictable.
Hotels: why the revenue loss outruns the occupancy loss
The gap between a six-point occupancy decline and a twenty-two percent revenue decline is not a discrepancy. It compounds in three stages.
Percentage points are not percentages. July occupancy fell from 73.5% to 67.2%. That is 6.3 percentage points, which reads as a small number, but it means Page hotels sold 8.6% fewer room nights than a year earlier.
Rates fell alongside occupancy. Average daily rate declined from $129 to $120, down 7.0%. Page hotels were not protecting price while selling fewer rooms. They were filling fewer rooms and charging less for the ones they filled. Multiply 8.6% fewer rooms by 7.0% lower rates and hotel revenue falls about 15%, which is what RevPAR shows: $94.53 down to $80.58, a decline of 14.8%.
Short-term rentals fell harder. The lodging tax captures vacation rentals and online marketplace activity alongside hotels, and that segment weakened more, which pulls the blended tax figure below what hotel data alone would suggest.
Rates falling alongside occupancy is what separates a modest occupancy decline from a steep revenue decline. Had rates held, the same drop in rooms sold would have produced a revenue loss closer to nine percent rather than fifteen. Part of that rate decline is likely properties discounting to compete for fewer travelers, and part is a shift in what sells, with visitors managing trip costs by choosing lower-rate properties, midweek nights, or shorter stays. Both push average rate down, and both compound with the occupancy loss to widen the gap between rooms sold and revenue collected.
July hotel performance closely mirrored June. Occupancy 67.2%, rate $120, RevPAR down 14.8%. Because June’s numbers are now tied to a known tax outcome, that similarity supports a preliminary expectation for July collections. Across April through June, RevPAR declined about 13% on average while lodging tax fell about 20%, a relationship of roughly one and a half to one during this downturn. Applied to July 2025 collections of about $903,000, a decline of 20 to 25% would put July near $680,000 to $720,000 if current trends persist.
Short-term rentals
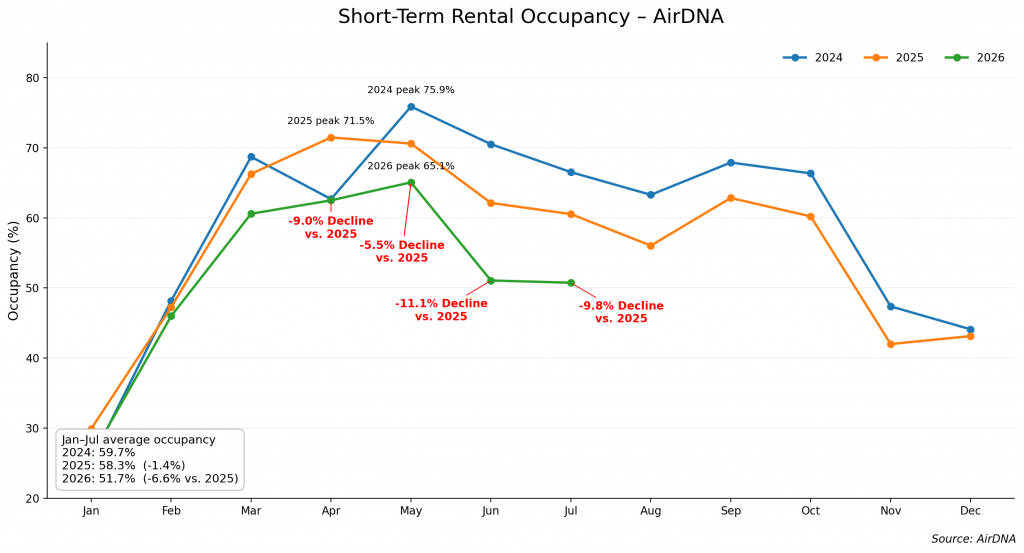
July short-term rental occupancy came in at 50.8%, down from 60.6% in 2025 and 66.5% in 2024.
The pace is the story. The decline from 2024 to 2025 was 1.4 points. From 2025 to 2026 it was 6.6 points.
Page has added substantial rental inventory in recent years, and more units dividing similar demand always lowers occupancy without necessarily meaning fewer visitors. That supply effect is real and has been present for several years. But it does not account for a decline of this speed arriving alongside falling hotel occupancy, falling rates, and falling tax collections. The 2026 weakness reflects demand, not only supply. STR inventory skews towards larger properties with multiple rooms, and subsequently higher costs, which might also account for the higher declines compared to traditional lodging.
How Page compares
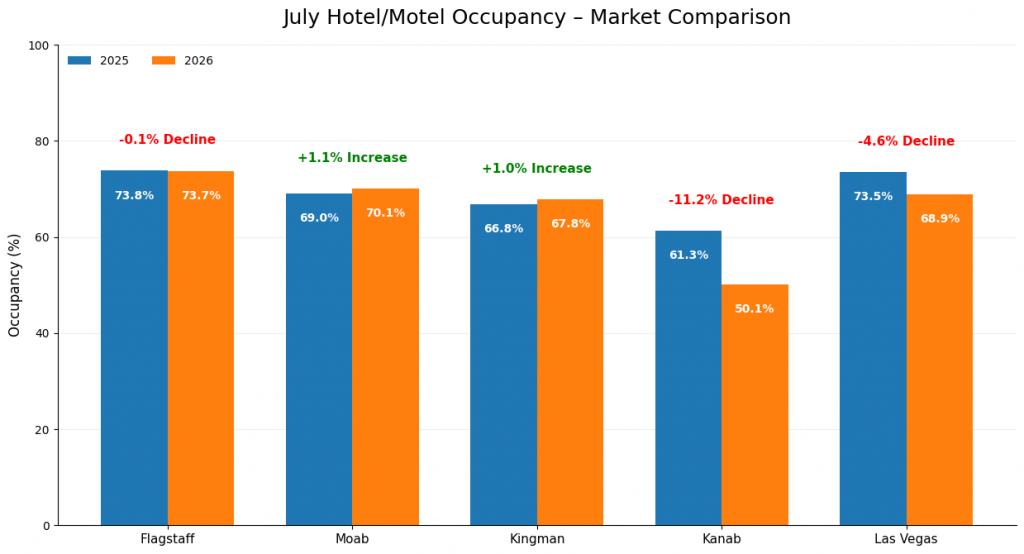
July hotel occupancy across regional markets:
- Flagstaff: 73.7%, essentially flat against 73.8% a year earlier
- Moab: 70.1%, up from 69.0%
- Kingman: 67.8%, up from 66.8%
- Las Vegas: 68.9%, down from 73.5%
- Page: 67.2%, down from 73.5%
- Kanab: 50.1%, down from 61.3%
Page declined 6.3 points while Flagstaff held flat and both Moab and Kingman gained. Las Vegas softened by 4.6 points, and Kanab fell furthest at 11.2 points.
That spread argues against reading this as a general tourism downturn. If demand were falling everywhere, Moab and Kingman would not be up. The pattern points instead to uneven performance across the region, with Page and Kanab showing the steepest declines.
What is likely behind it
No single factor accounts for the magnitude, and national hotel performance has not deteriorated at anything close to this rate.
Roughly two thirds of Page’s visitors are international, which makes the destination far more exposed than national figures suggest. If international visitors were a tenth of national lodging demand, a ten percent drop in that segment would reduce national demand by about one percent. At Page’s concentration, the same drop removes several times that share of local demand. International weakness can be nearly invisible nationally while being significant here.
Higher fuel costs also weigh most heavily on middle-income and road-trip travelers, which is consistent with both the rate decline and the sharper weakness in short-term rentals, where price-sensitive travelers concentrate. And the clustering of weakness in Page and Kanab rather than across all Southwest markets suggests something specific to the Western Grand Circle touring route rather than a broad decline in leisure travel. Springdale, Utah only saw a 1% gain for July, after years of strong increases.
Finally, the media coverage on lake levels, in addition to the temporary closures of several launch ramps on Lake Powell appear to be another contributing factor to declining tourism demand for Page specifically.
The bottom line
Page’s lodging sector is operating at a materially lower level than a year ago, and that shows across hotels, short-term rentals, and tax collections alike. But the decline stabilized after April rather than continuing to worsen, which is a meaningful distinction.
The rest of the local economy has held up better than the lodging line, and the fiscal year to date decline of 3.0% remains far milder than any single month suggests.
The immediate priority is understanding the rate decline, because whether Page is discounting into soft demand or serving travelers managing costs by shifting when and how they stay leads to different responses. For local businesses, the practical implication is that this market is rewarding value, flexibility, and midweek demand more than it has in several years.
The City is here to help local businesses compete and grow. Reach out any time by visiting our Contact Us page.
Note: City sales tax figures reflect the month in which revenue was generated. Hotel data is from CoStar and short-term rental data from AirDNA; both reflect participating properties and market estimates. The July lodging tax figure referenced is a preliminary estimate based on the recent relationship between hotel performance and tax collections, not actual data. Figures are rounded.