Page's Economy Diverges: Lodging Falls While Business Investment Climbs
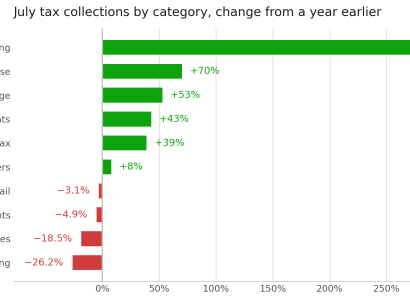
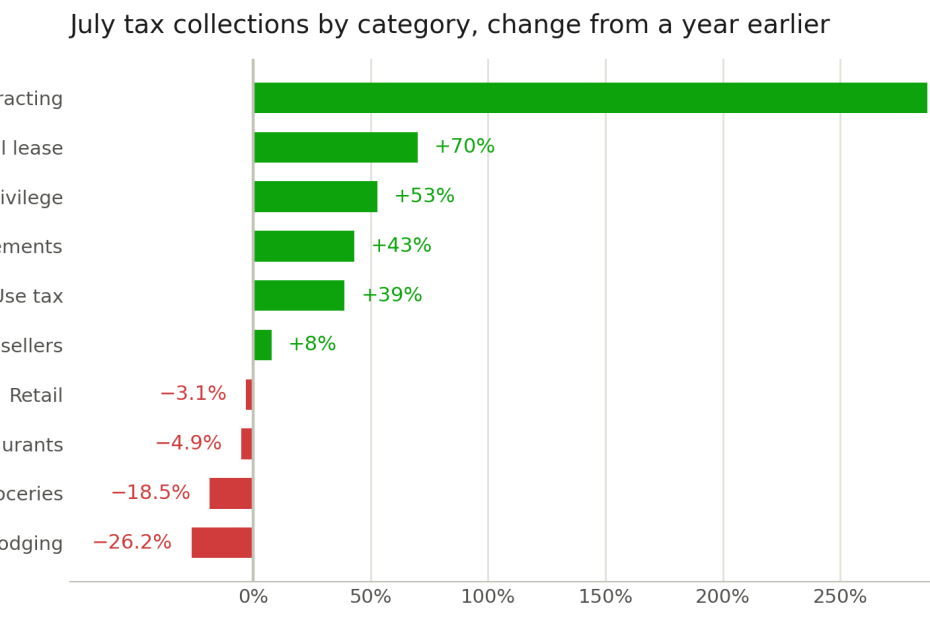
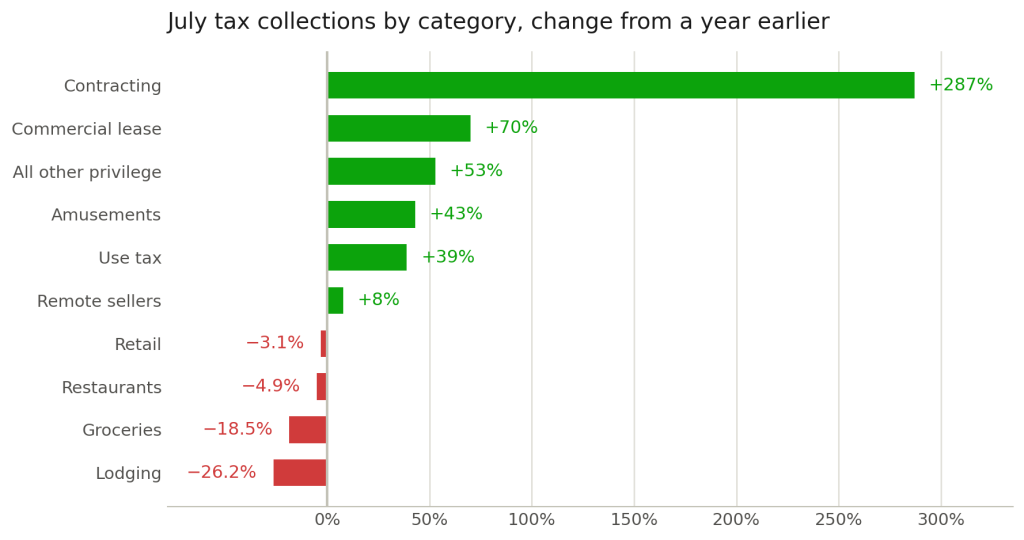
July lodging tax collections fell 26.2% from a year earlier. Over the same month, contracting tax collections rose 287% and commercial lease collections rose 70%. Both figures describe an economy moving in two directions at once.
The July numbers
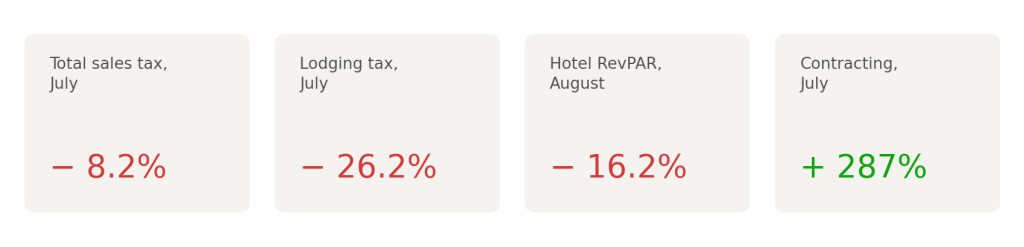
Total city sales tax generated in July was about $1.79 million, down 8.2% from roughly $1.95 million a year earlier. Trailing twelve month collections are down 4.5%.
Lodging accounts for a big portion of the decline. The hotel, motel, vacation rental, and bed and breakfast category collected about $666,000, down from roughly $903,000, a decline of 26.2%. At 37.3% of all July collections, lodging remains the largest single category, so movement there drives the headline number.
The other half of the ledger
Outside lodging, several categories moved higher.
Contracting collections were about $84,000 against roughly $22,000 last July, the strongest month in recent record. Contracting tax is project driven and moves sharply with individual construction activity, and this July reflects real work underway. Use tax rose 39% and the all other privilege tax category, which captures speculative and owner builder construction, rose 53%. Amusements, which captures tour and recreation activity, rose 43%.
Commercial lease collections came in at about $33,000 against roughly $19,000 a year earlier. That category swings considerably month to month, ranging from roughly $16,000 to $58,000 over the past year, so a single month should be read as movement within a normal band rather than as a step change in leasing activity.
The count of businesses operating here also grew. In July 2,789 taxpayers reported revenue, against 2,589 a year earlier, roughly 200 more. Eight new transaction privilege tax licenses were issued in July against five a year ago.
Retail was down 3.1%, restaurants down 4.9%, and grocery collections down 18.5%.
One accounting note. July collections included an unusually high share of payments applied to prior periods, with about 89% of the month’s total applicable to July activity itself. Some of the category gains reflect timing rather than activity in the month.
Construction and development activity
Several identifiable projects are behind the construction figures.
The Wesley Hotel completed a 49 key renovation, and the former Comfort Inn and Suites has been rebranded as a Fairfield by Marriott Inn and Suites. Love’s is actively constructing a travel center with 21 RV hookups and four additional RV spaces. Visible residential remodeling is underway across several neighborhoods, and downtown has seen a coffee shop relocate, an ice cream parlor open up, as well as a new Indian restaurant within the past year. Additionally a school expansion is adding five classrooms, additional office space, restroom and expanded parking.
The forward pipeline is larger than the current activity.
On the lodging side, more than 650 rooms and guest units are proposed or in development across five projects. The largest is a 415 room resort with a Diné cultural center on Navajo Nation land near Horseshoe Bend, which is currently considered under construction. The remainder consists of hotel, bungalow, glamping, and villa concepts at various stages.
On the residential side, roughly 345 units are proposed or in process. Of those, 82 units are in active projects, with another 64 units currently moving through subdivision review. This includes a workforce and student housing project, which addresses a constraint the City has identified repeatedly.
Commercial real estate context
Page’s leasing conditions sit inside a national picture that has been favorable for retail property.
National retail vacancy stood at 4.9% in June and is projected to finish 2026 at 5.0%, roughly 60 basis points below the sector’s long term average, with asking rents forecast to rise about 1.2%. A historically small construction pipeline continues to support occupancy. The Phoenix market, the nearest major metro, is holding at 4.7% vacancy with asking rents up 4.6%, placing it among the nation’s strongest major markets for retail rent growth.
Office is the distressed commercial sector nationally. Retail, particularly smaller format and food oriented space, has held up well.
There is also an inflation effect worth noting for local property owners. Commercial space priced several years ago and left vacant has become meaningfully less expensive in real terms as general prices rose, without the owner adjusting the asking rate. Rising construction costs make building new space more expensive, which increases the relative appeal of existing inventory. Both factors can bring long vacant units into a viable range without any visible change in the market.
Hotels
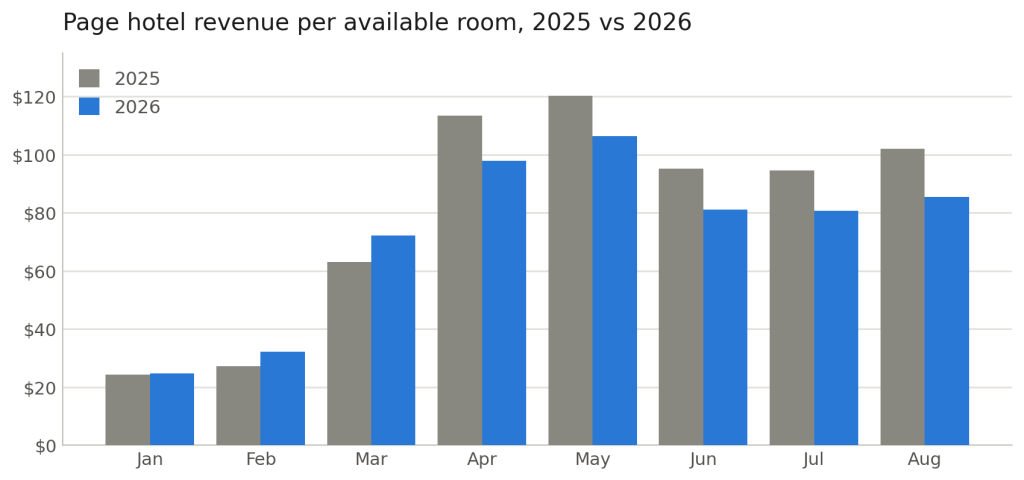
August was the deepest month of the current decline, however the drop was mostly consistent with what we have been experiencing the last few month.
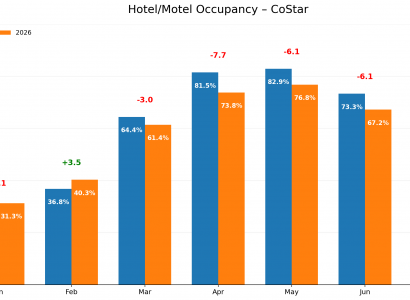
Occupancy came in at 67.2%, down from 74.8% a year earlier, a decline of 7.6 percentage points. Average daily rate fell to $127 from $136, down 6.6%. Together those produced a revenue per available room decline of 16.2%, steeper than the 14.8% recorded in both June and July.
Rates and occupancy continue to fall together. Page hotels are filling fewer rooms and charging less for the ones they fill, which is why revenue declines run roughly twice the size of occupancy declines.
On a trailing twelve month basis, average rate is down 4.6% and revenue per available room is down 10.2%. Those figures understate current conditions, because the strong summer months of 2025 are now rolling out of the twelve month window. Monthly comparisons are the better guide.
The relationship between hotel performance and lodging tax has been widening. In May, lodging tax fell about 1.4 times as fast as hotel revenue per available room. In June it was 1.5 times, and in July 1.8 times. Short term rentals are pulling the blended figure down harder each month.
Short-term rentals
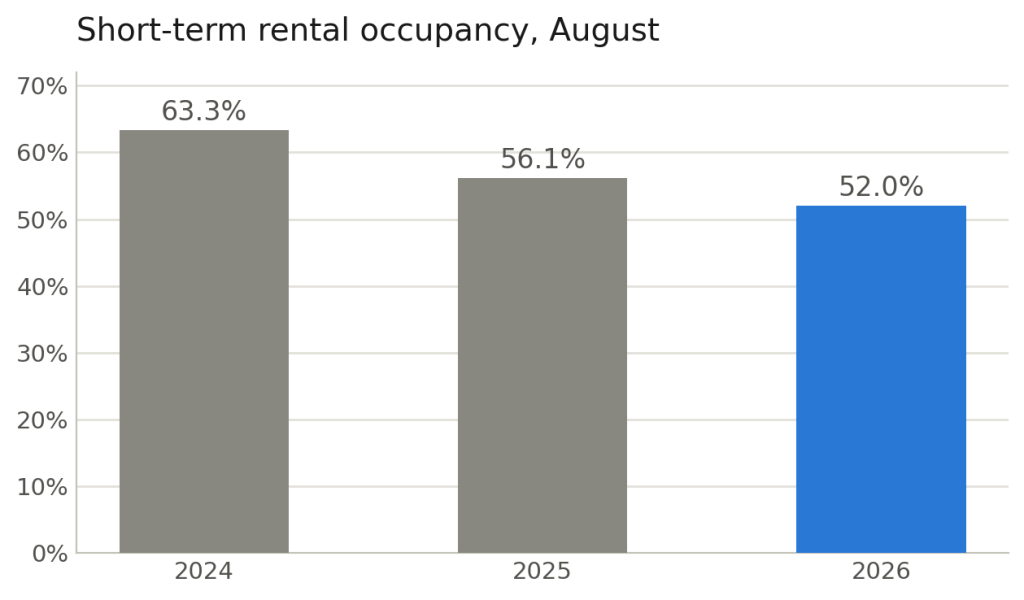
August short term rental occupancy was 52%, down 10.4 points from a year earlier. Revenue fell 15.9%, with entire home properties down 17.6% and apartments down 9.2%. Rates fell 6.1%, which is closer to a 9% decline after accounting for inflation.
Professionally managed properties declined most, down 21%. Luxury properties fell 10.7%. Because professionally managed and luxury inventory tends toward larger properties with higher nightly costs, this is consistent with visitors trading toward smaller and less expensive accommodations.
Two behavioral measures are worth watching. Booking lead time fell 12.3% from this time last year, meaning travelers are deciding later. Average length of stay fell 1.9%, meaning trips are slightly shorter.
One structural change stands out. Active listings totaled 533, down 0.7% from a year earlier. Previous reads on occupancy declines could be partly attributed to more units dividing similar demand. That explanation no longer applies. The current decline reflects demand.
New visitor data
The City’s new data analytics platform, Datafy, became operational this month, providing detailed domestic visitor information for the first time.
Three quarters of trips to Page originate outside Arizona. Utah is the largest single contributing state at 17.9%. The Phoenix and Prescott market accounts for 52.1% of visitor spending, with those visitors averaging about $37 per trip.
Visitor spending concentrates in grocery and department stores, leisure and recreation, and service stations, totaling roughly $80.6 million.
The typical domestic visitor is between 45 and 64 years old, travels in a household of three or more, and 59.4% report household income of $75,000 or more.
Most notably, 39.3% of domestic visitation comes from repeat visitors. That level of return visitation indicates genuine destination loyalty rather than one time bucket list travel.
Preliminary September figures, covering most of the month, show roughly 173,000 domestic trips with an average stay of 2.4 days. Visitor spending is running approximately 60% above the 2018 baseline.
How Page compares
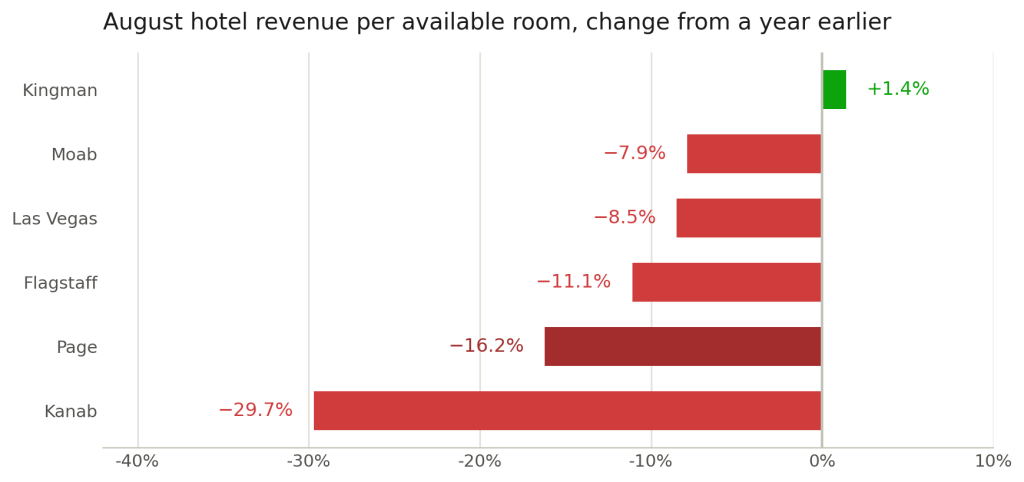
August was broadly weaker across the region, which marks a change from July when several comparison markets were still gaining. Only Kingman improved, with revenue per available room up 1.4%. This can be attributed to several large construction projects in the area, requiring the need to house a large, temporary workforce. Moab fell 7.9%, Las Vegas 8.5%, and Flagstaff 11.1%, a notable reversal for a market that was essentially flat a month earlier. Page declined 16.2% and Kanab fell 29.7%, the steepest in the group, with occupancy there dropping 13.7 points to 50%.
That spread places Page in the weaker half of the region rather than alone at the bottom, and it suggests conditions softened regionally in August rather than only locally. The decline in Las Vegas is worth noting separately, since it serves as the primary gateway for much of the touring traffic that reaches Page.
The two markets most dependent on the Western Grand Circle touring route, Page and Kanab, remain the weakest performers in the set. That pattern has now held for three consecutive months, which points to something specific to that corridor rather than a uniform decline in leisure travel. It was noted that Zion National Park visitation has started to level off after many years of sharp increases. This confirms the slowdown of visitors from this portion of the Grand Circle is becoming more visible in the data, an area that seemed to previously be unaffected.
What this tells us
Visitors are still coming to Page. Domestic visitation remains substantial, spending is well above historical norms, and tour and recreation activity grew 43% year over year. What has changed is what visitors pay for lodging and how long they stay.
The pressure appears concentrated on the accommodation decision rather than the decision to travel. Falling rates, shorter stays, later bookings, and a shift away from larger and more expensive properties all point in the same direction.
August also makes clear that this is not solely a Page problem. Five of six regional markets declined, including the Las Vegas gateway. What distinguishes Page and Kanab is the depth of the decline rather than its existence, and both sit on the same touring corridor.
International demand, higher fuel costs affecting a drive market, and coverage of Lake Powell conditions remain the most likely contributors. No single factor accounts for the full magnitude.
Interest in Page has not declined. Website traffic and social engagement both rose about 20% over last August, and search volume increased. The constraint is showing up between interest and booking rather than at the top of the funnel.
The bottom line
While Page’s lodging sector is operating well below last year, the City invested approximately $36,000 in visitor marketing during August. Website traffic and social engagement each rose about 20% over last August. Marketing efforts likely contributed between 1,200 and 2,000 additional hotel room nights sold, roughly 4-6% of the month’s total.
A larger international campaign with Brand USA, partially funded by the Arizona Office of Tourism, begins in the coming months and is expected to add several hundred additional room nights per month. It will run alongside the current international booking platform campaigns.
While the cities tourism efforts work to prevent larger declines, visitor spending itself remains well above historical 2018 levels, and nearly 40% of domestic visitors are returning. On the economic development side, construction activity, commercial leasing, and new business formation are all up substantially. Two hundred more businesses are reporting revenue than a year ago.
The City now has visitor data it has never had before, which will allow marketing decisions to be evaluated against actual visitation rather than estimated exposure. As the city expands economic development efforts, further business expansion is anticipated throughout the fiscal year.
For local businesses, the practical implication remains that this market is rewarding value and flexibility. The City is here to help local businesses compete and grow. Reach out any time through the contact page at choosepage.com.
###
*Note: City sales tax figures reflect the month in which revenue was generated. Hotel data is from CoStar and short term rental data from AirDNA; both reflect participating properties and market estimates. Visitor data is from Datafy and covers domestic visitation only. September visitor figures are preliminary and cover most of the month. Figures are rounded.*