Cooling, Not Collapsing: What Page's Spring Numbers Really Say
Economic Report June 2026
Page, AZ (6-30-26) — Page’s tourism economy is softer than it was a year ago. That much the data makes plain. But the more useful question for residents and business owners is why, and on that, the headline decline tells only part of the story. A closer read points to a market that is normalizing after an extraordinary post-pandemic run, absorbing a wave of new lodging supply, and weathering national and international headwinds that have little to do with Page itself. The destination is cooling. It is not collapsing.
The headline, in context
April 2026 city sales tax collections came in around $1.76 million, down 9.7% from roughly $1.94 million in April 2025. Zoom out, and the picture is steadier: fiscal-year-to-date collections are down just 1.2%, and the trailing 12-month total is still up 2.2%.
Those three numbers seem to disagree. They don’t. They’re measuring different things at different speeds. The positive 12-month figure is still buoyed by an unusually strong start to FY26, especially last July and August. As those banner months roll out of the rolling comparison later this year, the recent softness will likely show through more clearly. The economy isn’t in crisis. The pace has changed.
One modest, April-specific wrinkle is worth noting. Easter moved from April 20 in 2025 to April 5 in 2026, shifting some spring-break travel into late March. That timing helped push March collections to an all-time high, though only modestly above 2025, which suggests the Easter effect is real but small. It explains a little of April’s gap, not most of it. The bulk of the story lies elsewhere: more lodging supply, softer rates, and a broader cooling in travel demand. The cleanest read still comes from looking at March and April together, or from the smoother trailing averages, rather than from a single month.
Lodging is the soft spot, but lodging tax isn’t the same as visitation
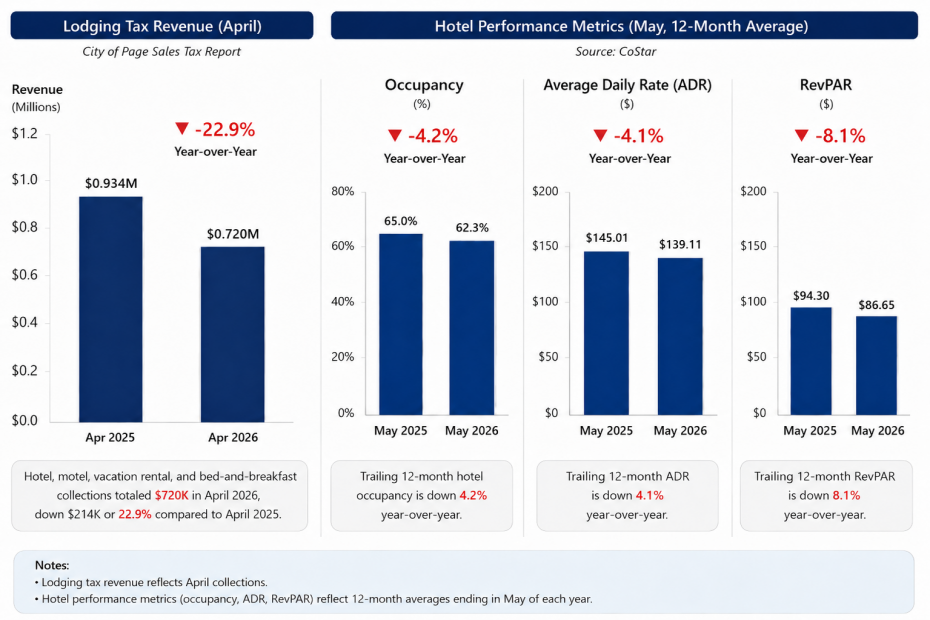
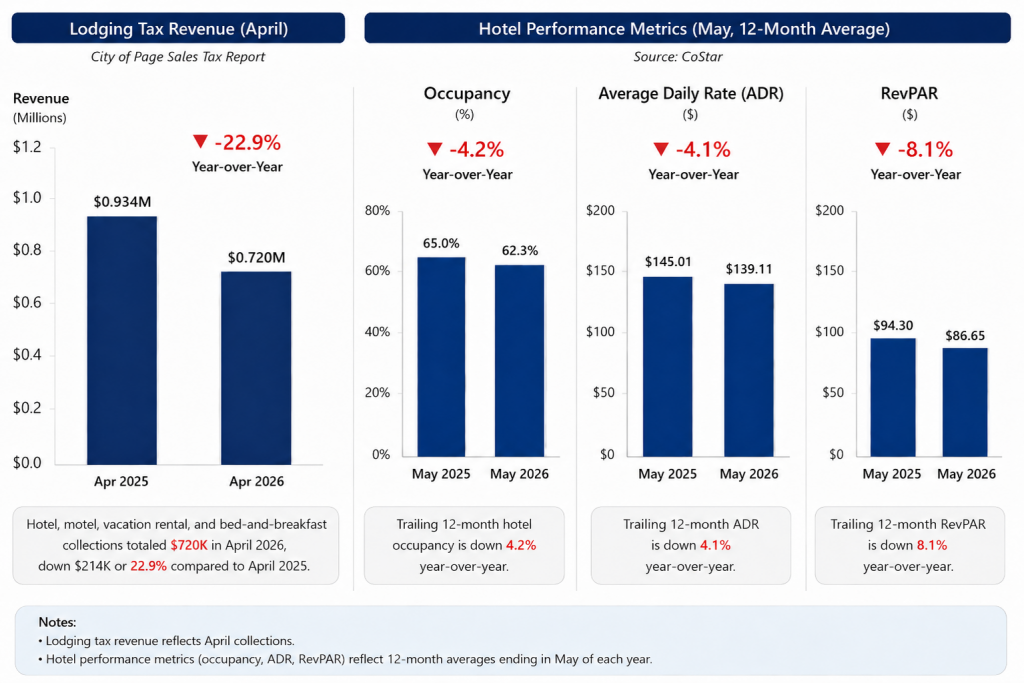
The clearest weakness is in rooms. Hotel, motel, and vacation-rental collections totaled roughly $720,000 in April 2026, down 22.9% from about $934,000 a year earlier. Because lodging made up about 41% of all April collections, that one category drags the entire report.
Here’s the distinction that matters: lodging tax is driven by total taxable room revenue, a function of both how many rooms sell and at what price. If visitors keep coming but rooms sell for less, tax collections can fall faster than actual visitor activity. That appears to be a real part of the current story.
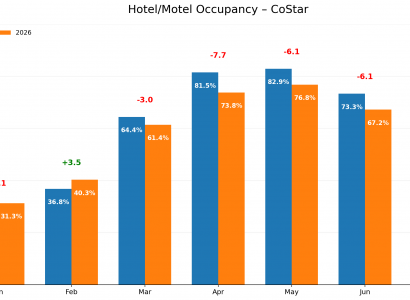
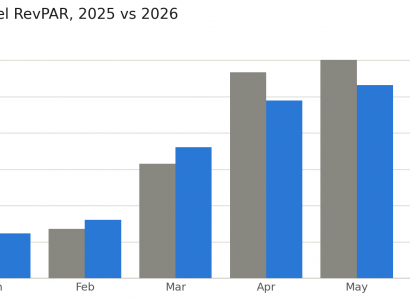
Because sales tax reporting lags, the city’s latest data reflects April, while hotel-market data runs more current. The clearest signal is in the month-over-month comparisons. Per CoStar, April hotel occupancy fell to 73.8% from 81.5% a year earlier, and May to 76.8% from 82.9%. Rates softened alongside: April average daily rate (ADR) eased from about $139 to $132, and May from about $148 to $138. Lower occupancy and lower rates compound; together they cut revenue more than either would alone.
The trailing 12-month averages look milder, occupancy down 4.2%, ADR down 4.1%, and revenue per available room (RevPAR) down 8.1%, with occupancy easing from a peak near 65% in April 2025 to about 62.3%. But like the 12-month sales-tax figure, those averages are still cushioned by last year’s stronger months. They describe where the market has been, not the sharper softening the recent monthly numbers show. One tentatively encouraging note: May’s year-over-year gap was narrower than April’s.
The supply story behind the softness
The short-term rental market adds the missing piece, and it’s arguably the most important one. Page carries a large vacation-rental segment, and the data shows a market that is busier than the revenue suggests. Total Airbnb listings rose 8.2% over the past year. Booked listings actually increased, from 528 in May 2025 to 569 in May 2026, while total listing-days-booked held essentially flat at about 10,200.
Read those numbers together and the dynamic is clear: demand hasn’t disappeared, but supply has grown faster than demand, spreading roughly the same number of booked nights across more units. The result is predictable: May short-term-rental occupancy has slid from about 75% in 2023 to 70% in 2024 to 62% in 2026, revenue is down 10.6% over the past year, average revenue per listing is off 8.4%, and average nightly rates have softened from about $236 to $230.
For existing operators, the message is straightforward: the market is still active, but less forgiving. More units are chasing the same demand, occupancy is trending down, and revenue per listing is under pressure. Page can still support well-located, well-managed, sensibly priced properties, but the days of automatic high-occupancy are, for now, behind us.
Page isn’t alone: the national backdrop
Step back, and Page’s slowdown looks less like a local stumble and more like a local version of a national one. According to CoStar and STR, U.S. hotel RevPAR fell in 2025, the first non-recessionary decline ever recorded for the American hotel industry, and the 2026 outlook is for slow, uneven growth, with industry forecasters expecting supply to outpace still-fragile demand and ADR to rise more slowly than inflation. National occupancy is running around 62%, strikingly close to Page’s own trailing figure. Analysts also describe a “bifurcated” consumer: higher-income, luxury travel has held up, while budget and mid-tier demand has softened alongside weaker consumer confidence. In short, the forces pressuring Page (more supply, softer rates, value-conscious travelers) are pressuring the whole country.
International travel adds a second layer, and it lands close to home for a Grand Circle gateway. Canadian travel to the U.S., historically the single largest source of foreign visitors, fell roughly 22% in 2025 and has stayed down by double digits well into 2026 amid a sustained, politically driven boycott. European demand has cooled too, with U.S. favorability at multi-year lows in several key markets. Layered on top is a new federal nonresident national-park surcharge: since January 1, 2026, non-U.S. residents pay an extra $100 per person to enter 11 of the most-visited parks, including the three that bracket Page’s itinerary: Grand Canyon, Zion, and Bryce Canyon. For a destination whose international visitors largely arrive mid-road-trip between those parks, these are real, if largely external, headwinds.
There is a quiet competitive advantage worth noting in the same breath: Page’s marquee draws (Antelope Canyon, Horseshoe Bend, and Lake Powell) sit outside that federal surcharge. In a year when the cost of the surrounding parks is rising for international guests, Page can credibly position itself as the high-impact, surcharge-free heart of the loop.
Two local wildcards: water and fuel
Closer to the ground, two factors specific to this region cut across the outlook.
The first is Lake Powell. After a winter of near-record-low Rocky Mountain snowpack, the reservoir is running at roughly 20% of capacity, with its surface near 3,527 feet, about 32 feet lower than a year ago and within striking distance of the 2023 record low, according to the U.S. Bureau of Reclamation. The lake remains open for business, but the media’s outsized portrayal of the impacts are affecting travel plans. Boats can still launch, and the marina restaurants are still open for business, so it’s actually a great time to come out and visit, however the city is just not seeing the numbers like before.
The second is fuel, the lifeblood of a drive-to destination. A spring spike tied to Middle East conflict and disruption at the Strait of Hormuz pushed the U.S. average toward $4.56 a gallon by late May, squarely through Page’s soft spring window and a clear deterrent for budget-minded road-trippers. The better news: prices have fallen for several straight weeks, dipping back below $4.00 as the summer season opens, a modest tailwind arriving just in time for the months that matter most.
The fuller picture, and what to watch
Lodging’s troubles are real, but they aren’t the whole economy, and the rest of the report supports a more balanced view. Restaurants, bars, and catering are up 7.8% fiscal-year-to-date. Food for home consumption is up 2.4%, remote-seller collections up 12.7%, commercial lease activity up 1.2%, and use tax up 11.2%. Retail is roughly flat year-to-date (down 0.5%), though April retail did fall 16.1%, and amusements and contracting are down as well, a reminder that April’s softness reached beyond lodging.
Taken together, the picture is of a local economy that is cooling, not cratering. Page rode several years of unusually strong, post-pandemic travel demand and elevated spending. That period has given way to a more normal and more competitive environment, where gains are harder won, pricing power is thinner, and lodging supply plays a larger role in the headline numbers.
The next few months will be telling. Last July and August were exceptionally strong, and Page is unlikely to see the same lift this year. If summer comes in below that elevated pace, year-over-year comparisons could look tougher in coming reports. That possibility is worth taking seriously, and worth keeping in proportion.
Because the fundamentals haven’t moved. Visitors are still coming. Page remains one of the most recognizable destinations in the Southwest, and Lake Powell, Horseshoe Bend, Antelope Canyon, and the surrounding public lands continue to anchor the local economy. The market is changing. The task now is to read that change clearly, plan realistically, and keep sharpening what makes Page competitive for the long run, because in a market where travelers have grown more selective, pricing, service, marketing, and visitor experience will matter more than they have in years.
View the latest sales tax report: https://cityofpage.org/wp-content/uploads/2026/06/04-APRIL-2026-SALES-TAX-REPORT.pdf
Note: CoStar (hotel) and short-term-rental (AirDNA) figures reflect aggregated performance of participating properties and market estimates, provided for general market context. National lodging figures are from CoStar/STR and Tourism Economics; Lake Powell elevations from the U.S. Bureau of Reclamation; fuel prices from AAA. Some external data points are indicative and current as of late June 2026.